ECOLE POLYTECHNIQUE DE LOUVAIN

PEROVSKITE.
INTRODUCTION
The objective of this section is to thoroughly study the technical aspects of our perovskite solar cell. What properties does it have? How are they useful for photovoltaïc applications? How does this perovskite stand out from other materials? What is its maximum conversion efficiency? Moreover, we will also study the technical aspects of a classic photovoltaïc cell, which is based on Silicon. The same questions as for perovskite will be studied.
By answering these questions and many more, we should be able to have an idea whether or not making a solar cell with our material is relevant for the future of solar energy or not.
The perovskite structure takes its name from the calcium carbonate compound (CaTiO3). The general structure for perovskite is ABX3 where A and B are both cations, of often varying size whilst X is an anion bonded to the other cations, as seen on Fig. 5. In the context of this project, our group will be studying methylammonium lead iodide, whom’s molecular formula is : CH3NH3P bI3. In this case, A is a monovalent organic cation (CH3NH3= ), B is a Pb2+ divalent cation and X is a monovalent iodide anion I–. This pervoskite has the particularity of belonging to the group of organic–inorganic halide perovskites (OIHPs).
In our project, CH3NH3PbI3 will be mentioned by various names : methylammonium lead iodide pervoskite, methylammonium lead halide, MAPbI3, MAPI.

Figure 1: ABX3 structure of perovskite
CH3NH3PbI3 perovskite
The crystalline structure of MAPbI3 (MA = methyl ammonium) organizes itself in the following way: the I and Pb atoms form a 3D structure of octahedron sharing their corners. Each octahedron has a Pb atom in its center and I atoms at its corners. The PbI6 octahedra form a cuboctahedral cage in which the organic CH3NH3+ is located [2]. CH3NH3PbI3 perovskite exhibits a complex structural behavior with different phase transitions depending on temperature. At very low temperatures, it present an orthorhombic configuration which, at a temperature of 162.2K, transforms into tetragonal, before becoming cubic at 327.4 K. [3]
In the cubic phase, the octahedron is rather large compared with the general perovskite-type crystal such as BaTiO3, hence, it is considered that MA+ ions can move freely inside the cage at high temperatures. [4]. Indeed, let’s have a closer look at the BaTiO3 perovskite in its cubic phase. Its crystalline structure consists of corner-sharing octahedral TiO6 units. These octahedra define a cubic space in the center of which a Ba2+ ion is located, as illustrated in the figure below. If its octahedra are larger than those of the MAPI perovskite, it means that the baryium cation will have more space to freely rotate and move. This can be analyzed by looking at the Shannon radii of the cations located at the center of the octahedra : the bigger they are, the bigger the octahedra. Note that the Shannon radius of an ion is a radius that will change depending on the coordination number of this ion. In the case of BaTiO3, the cation located at the center of its octahedra is Ti4+. It has a coordination number of 6. By consulting the database of Shannon radii of the Atomistic Simulation Group of the Department of Materials at Imperial College London[5], we have that r_Ti4+ = 0.061 nm. Similarly, we can apply the same reasoning for the MAPI perovskite. As seen on Fig. 9, the ion located at the center of its octahedra is Pb2+, its coordination number is 6 as well. Consulting the database, we have r_Pb2+ = 0.119 nm. Hence, we have effectively shown that the octahedra will be larger in MAPI than in BaTiO3 perovskite, will indeed gives more space for the MA+ ion to rotate. Another aspect that can be considered is the size of the cations located at the center of the cage formed by the octahedra : MA+ for MAPI and Ba2+ for BaTiO3. The coordination number of the baryium cation Ba2+ is 12, its corresponding Shannon radius is r_Ba2+ =0.161 nm. For the MA+ cation, its radius is the following : R_MA+ = 0.18 nm. We notice that the radius of the MA cation is slightly larger than the baryium cation. However, the size of the octahedra of MAPI are two times larger than the octahedra of BaTiO3, we can hence safely conclude the MA+ cations can move freely inside the cage made by the octahedra.
The orientation of the organic cation and of the octahedra will have its importance in the phase transitions of MAPI. Indeed, the octahedral tilting due to the size mismatch between the A-site cations and the BX6 cage leads to 3 different different phase regions : orthorhombic (327.4K). Depending on the temperature, the MA+ will more or less be able to move inside its inorganic cage. Indeed, in the orthorhombic phase, we can consider we have fully ordered MA cations. Following that, in the tetragonal phase we have partially ordered cations with 8 possible orientations [7]. Finally, in the phase at the highest temperature, cubic, we have fully disordered MA cations, as discussed earlier. It has been reported by Weller [8] that there are 24 possible molecular orientations of the cation for MAPI in its cubic conformation. Usually, the temperature of a photovoltaïc panel can range from 233◦C up to 350◦C. Hence, the crystalline structures we will be the most interested in studying for our application are the tetragonal and cubic ones.
The possible space groups of the crystal are the following for respectively orthorhombic, tetragonal and cubic structures : Pnma, I4/mcm and Pm-3m. The MAPI perovskite lattice parameters in its 3 different crystalline structures are given in the following table
The space group of the crystal at low temperature is Pnma (orthorombic)
This perovskite has the followings lattice parameters:
Another interesting point to consider when describing the crystalline structure of a material are its 15 Wyckoff positions. They tell us where the atoms are situated in the crystal. Each Wyckoff position is denoted by a number and a letter. The number describes the multiplicity of the site, in other words, how many atoms are generated by symmetry if a single atom is placed at that position. The letter holds no physical meaning and is just a label. For every structure, irrespective of symmetry, the list starts with "a" which is the site with the highest symmetry. The Wyckoff positions for the orthorhombic, tetragonal and cubic crystalline structures are respectively given in Tab. 2, Tab. 3 and Tab. 4.

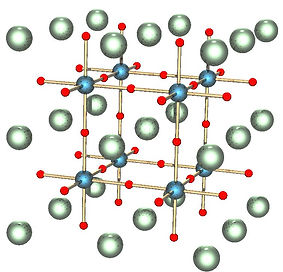
Table 1: Lattice parameters of MAPI perovskite in its 3 crystalline structures : orthorhombic, tetragonal and cubic.[9] The lattice parameters were characterized by X-ray diffraction (XRD) on a PANalytical X-ray diffractometer (Model EMPYREAN) with a monochromatic Cu K_α1 radiation. A K_α X-Ray is emitted when an electron goes from the L shell to the K shell. A K_α emission is composed of 2 spectral lines : K_α1 and K_α2. K_α1 has slightly higher energy and lower wavelength. The lattice parameters were precisely determined using Si powders as the internal standard reference material.
Figure 4 and 5 : Cubic crystalline structure of barium titanate perovskite (BaTiO3). The red spheres are oxygen atoms, the blue are Ti4+ cations and the green sphere are Ba2+ (left). Cubic crystalline structure of MAPI perovskite also known as methylammonium lead halide. The purple atoms are I, Pb is grey (located inside the octahedra), H is pink, N is brown and C is light blue.[6] (right)

Figure 3: Structural phase transitions[3]

Figure 2: The unit cells of the cubic, tetragonal and orthorhombic phases of MAPI perovskite in the ball-and-stick representation. [1]
Table 2: Theoretical values of the Wyckoff position from Materials Project for the orthorhombic structure[10]
Table 3: Wyckoff positions for tetragonal structure of MAPI (space group I4/mcm). High resolution structure of CH3NH3P bI3 was measured at 295K using the TOPAZ single crystal neutron diffractometer at the ORNL Spallation Neutron Source. [11]
Table 4: Wyckoff positions for cubic structure of MAPI (space group Pm-3m). High resolution structure of CH3NH3P bI3 was measured at 350K using the TOPAZ single crystal neutron diffractometer at the ORNL Spallation Neutron Source. The site occupancies of the disordered CH3NH+ 3 moieties were refined using a model with the cation aligned along the [111], [100], and [011] directions of the unit cell. However, the cation resides primarily along the [011] direction[11].
The unit cells of the CH3NH3PbI3 in their 3 possible crystalline configurations (orthorhombic, tetragonal and cubic) are shown in Fig. 6 in polyhedral representation and in Fig. 2 in ball-and-stick representation.

Figure 6: Polyhedral representation of the different polymorphs : (a) Orthorhombic structure, (b) Tetragonal structure, (c) Cubic structure. Each atom is related to a color: I is purple, Pb is grey, H is pink, N is brown and C is light blue. For methylammonium cations, a ball-and-stick model is used[2]. In the cubic and tetragonal structures, there is an increase of angular fluctuations of CH3NH3+ as temperature increases. For the sake of illustration, the cation has been arbitrarily fixed in a specific direction.

Polyhedral representation.

"Ball and Stick" representation.

"Stick" representation.
I
N
H
Pb
C
Stability and future challenges of CH3NH3PbI3 perovskite
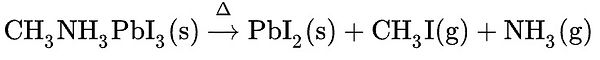
The efficiency of perovskite CH3NH3PbI3 has been improved during the last decades but its stability is an ongoing topic of research and discussion in the scientific community. Indeed, when perovskite was first studied, it was observed that it degraded over time, especially under environmental stresses such as light, heat and humidity. Heat and light can especially cause degradation under prolonged illumination or at elevated temperatures. [2] [12] These degradation are mainly possible because of the structural defects of our perovskite. The vacancy defects help the initiation of moisture, oxygen and light degradation. The thermal decomposition of CH3NH3P bI3 leads to the formation of methyl iodide and ammonia:
MAPI is also very susceptible to chemical degradation in a relatively humid environment. Lower levels of humidity (≈ 60% RH) have a negligible effect on the stability of the perovskite but higher levels of humidity (≈100% RH) result in the lead iodide (PbI2) and other decomposition products such as aqueous CH3NH3I. This will be problematic as it will considerably change the transport characteristics of the material. MAPbI3 is also sensitive to degradation in the presence of light and oxygen. However, it was demonstrated that this degradation can be considerably diminished by using interlayers that are able to remove electrons from the perovskite film before they can react with O2 to form O2- [13].
Other solutions have been reported in scientific literature in order to considerably improve MAPI’s stability in the long run. López et al. [14] have shown that the material can be very stable and maintain its performance for several years if processed with ball milling. Ball milling is mechano-chemical synthesis that consists in a grinder that blends the materials in fine powder. The main advantage of this technique is that it is simple, fast, cost-effective and green technology with enormous scalability potential [14].
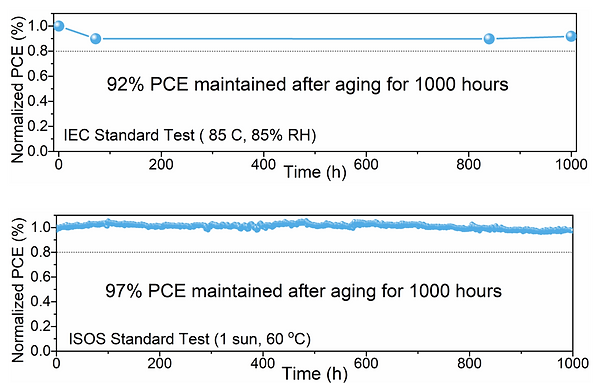
Figure 7: Power conversion efficiency with time for perovskite minimodules. The composition of the perovskite studied here is (FA0.80Cs0.20Pb(I0.94Br0.06)3. On the top, the PCE was measured with an IEC standard test under 85◦C and 85% relative humidity. On the bottom, the PCE was measured with an ISOS standard test under 1 sun at 60◦C. These figures come from a presentation given by Dr. Anurag KRISHNA, R&D project leader at IMEC, EnergyVille 2, Genk, 2023. [15]
Additional reference : Tamara Merckx, Aranzazu Aguirre, Yinghuan Kuang, Arvid van der Heide, Ali Hajjiah, YaserAbdulraheem, Anurag Krishna, Jef Poortmans, and Tom Aernouts. Stable device architecture with industrially scalable processes for realizing efficient 784 cm2 monolithic perovskite solar modules. IEEE Journal of Photovoltaics, 13(3):419–421, 2023
During the semester, we were able to visit EnergyVille 2 in Genk. It is a research center notably focused on studying and developing perovskite based solar cells. They have managed to produce perovskite minimodules that are noticeably stable over long periods of time, as seen on Fig 7. The precise composition of the perovskite they studied is (FA0.80Cs0.20Pb(I0.94Br0.06)3. A mini-module is by definition, a module of size between 10 and 200 cm2 , integrated by 4-10 units cells where each unit cell has a size smaller than 1 cm2 . The full classification depending on size is given in Fig. 8.

Figure 8: Classification of module sizes in 4 categories [16].
To achieve a stable perovskite minimodule, the researchers at EnergyVille 2 have studied several factors. Firstly, it is important to encapsulate the cell, it considerably reduces the problem of degradation of lead with humidity. This can affect the efficiency by decreasing it but it is negligible compared to the major advantage of avoiding degradation. Moreover, they also focused on manufacturing perovskite with as less defects as possible. Indeed, defects can be vehicules to ion migration. The interfaces are especially susceptible to ion migration. To mitigate this, the researchers at EnergyVille 2 propose to use passivation technique on the perovskite. This technique ensures that the material interacts to a lesser degree with its external environment. Passivation layers can either be chemical (fill the defects) or physical (isolate the perovskite solar cell from the external world).
Hence, the factors that affect the overall stability of CH3NH3PbI3 perovskite such as crystal quality, film thickness, and the presence of impurities like other materials can be more or less taken care of. However, the main challenge today is to scale-up perovskite solar cells to an industrial scale. Scaling-up leads to a loss in efficiency compared to lab scale. Indeed, to make large scale solar panels, we need to assemble modules together, this involves cables and connectors which in themselves lead to nonnegligible losses. Moreover, it is much harder to produce perovskite on a larger surfaces whilst limiting the amount of defects. As of today, the researchers at EnergyVille 2 are able to reach efficiencies of approximately 10% on panels of 30x30 cm. The hope is to be able to reach efficiencies of at least 18% in the future.
Another interesting aspect to note is that MAPI on its own is not the ideal material for future solar panels when scaling up. Indeed, its MA+ cation is highly volatile, which causes the perovskite to be unstable. To solve this issue, the cation can be removed. But then, it leads to other defects to compensate its removal: iodine vacancies. Defects are highly undesirable. Hence, future considerations for perovskite solar panels using MAPI would actually consist in a combination of it with different perovskites : formamidinium lead iodide (FAPI), cesium lead iodide, etc.
Indeed, during the presentation, it was explained by Dr. Krishna that nowadays, most perovskites are formamidinium rich with small amounts of cesium and methylammonium. Mixing perovskites together is necessary to compensate the drawbacks they would have on their own. For example, FAPI on its own is unstable and hard to crystallize. This is due to the fact that its FA+ cation is too large and does not fit in the crystal. The solution is adding MA+ cations (just 2% is enough), this allows to reduce the distortion of the crystal structure and makes it more stable.
Band gaps and refractive index of CH3NH3PbI3 perovskite
In the context of photovoltaïc cells, it is interesting to define two different band gaps : the fundamental band gap and the optical/absorption bandgap. The latter can be defined as the threshold for photons in order to be absorbed by the material, this creates an exciton : a bound state of an electron and a hole. The fundamental gap, on the other hand, is the threshold for creating electron-hole pairs that are not bound together. In other words, it is the energy needed to create a photon by separating an electron-electron hole pair.
MAPbI3 has a fundamental bandgap, believed to be direct, that is usually encompassed between values going from 1.5 eV to 1.6 eV. [17]. The electronic band structure, and thus, the bandgap, changes considerably from a scientific article to another due to the different approximations made and various methods of calculations. As seen on Fig. 9, the reported bandgaps of MAPI from calculations can vary considerably. Hence, to define our bandgap, we will have to chose values coming from a specific article but it must be noted that the value will always have a certain degree of uncertainty. Note that we will not be considering the band-gap value given by MaterialsProject. Indeed, they tend to show the Kohn-Sham bandgap on their website, which severely underestimates the value of the bandgap (compared to the experimentally observed one).

Figure 9: Comparison of the reported experimental bandgaps of MAPbI3 (obtained by absorption spectroscopy, diffuse reflectance spectroscopy, device stack ellipsometry) from both experimental studies, and first principles calculations for MAPI cubic phase.[17]
As seen on Fig. 9, various experimental values of bandgaps have been measured, they range from 1.5 to 1.6 eV. Comparatively, we observe that values obtained from theoretical calculations vary much more. Hence, it is preferable to use values obtained from experimental studies rather than theoretical ones if possible.
Depending on the crystalline structure (and thus, the temperature), the value of the bandgap of a material can change. Usually, when temperature increases, the bandgap tends to decrease. Indeed, when temperature increases, the crystal lattice tends to increase and the interatomic bonds weaken. Thus, less energy is needed to break a bond and transport an electron to the conduction band. However, in the case of MAPI, it is the opposite ! The bandgap increases with increasing temperatures. This is due to the fact its conduction and valence bands have opposite natures than those of other materials [18]. MAPI presents an p-like character of the conduction band and a s-like character of the valence band, which is the opposite of other materials.
In the context of a solar cell, the orthorhombic structure will never be present in our perovskite in atmospheric conditions. However, studying this cell structure can be much more easy, notably due to the fact that the orthorhombic structure is the only phase in which the position of the methylammonium ion is fixed. A band gap of Egortho = 1.71 eV has been measured expermientaly for a thin film of MAPI at 100K by recording absorption spectra [18]. Amnuyswat et al. [19] have measured an electronic band gap of Egtetra = 1.57 eV experimentally. Similarly, studying the near-band-edge optical responses of solution-processed CH3NH3PbI3 on mesoporous TiO2 electrodes by means of diffuse reflectance, photoconductance (PC), photoluminescence, and transient absorption (TA) spectroscopy, Yamada et al. have measured the fundemental bandgap of cubic MAPI to be : Egcubic=1.61 eV. [20]
It is interesting to note that the fundamental bandgap and the absorption bandgap are related by the following relationship : Eg = Eopt + EB where Eg is the fundamental bandgap, Eopt is the optical bandgap and EB is the exciton binding energy. As explained earlier, the optical bandgap is the energy needed to absorb a photon. An exciton is formed when a photon is absorbed : it is a quasiparticle that can be seen as an electron-hole pair that are attracted to eachother due to Coulomb forces. The fundamental bandgap is the energy needed to create a photon AND separate an electron-hole pair. This explains the relation of Eq. 1. In materials in which we have very little interaction between the electrons and holes (and hence, small exciton binding energy EB), the optical and fundamental bandgaps are essentially the same. Using four-wave mixing (FWM) spectroscopy, March et al. obtained results showing exciton binding energies ranging from 10meV to 30meV. [21] These values being considerably low, it is safe to assume that for MAPI, its optical and fundamental bandgaps are essentially the same. The bandgaps we will be using for this project are in Tab. 5.
Table 5: Experimental measurements of MAPI’s bandgaps for orthorhombic, tetragonal and cubic structures. The orthorhombic bandgap was measured experimentally by Filip et al.[18] using the “self-consistent scissor” GW (SS-GW) scheme which is explained in [22]. The tetragonal bandgap was measured experimentally by Amnuyswat et al. [19]. The cubic bandgap was measured experimentally by means of diffuse reflectance, photoconductance (PC), photoluminescence, and transient absorption (TA) spectroscopy by Yamada et al. [20]
Let it be known that the lower the exciton binding energy, the better. Having an EB as low as possible favors exciton self-dissociation, and hence, leads to the presence of free carriers. In MAPI, the free carriers display diffusion lengths of over one micron, with no significant loss. This is a very valuable property for an application in photovoltaïc cells and will be further discussed in this section.
Butler et al. have measured the absorption bandgaps for various halides : CH3NH3PbI3, CH3NH3PbBr3 and CH3NH3PbCl3. They were respectively observed at 1.60, 1.95, and 2.46 eV using photoemission spectroscopy[23]. From this observation, it can be concluded that the absorption bandgap of the hybrid organic/inorganic perovskite increases with the decrease of its halide atomic number (atomic size) [19]. This is especially interesting for MAPI, the greater the absorption bandgap, the lower the amount of sunlight that can be absorbed! In our case, we have the lowest absorption band of the 3 and can thus absorb a bigger spectrum of light compared to the other HOIPs, which is very relevant for photovoltaïc panels.
The refractive index of a medium is a dimensionless number that quantifies the medium’s light bending ability. The absolute refractive index is defined as:
n = c v
where c is the speed of light in vacuum and v is the phase velocity of light in the medium. We can also define the complex refractive index :
n(λ) = n(λ) + iκ(λ)
where n is the refractive index and κ is the extinction coefficient. Ziang et al. [24] conducted a study to measure the refractive index and extinction coefficient of our halide perovskite with spectroscopic ellipsometry and obtained the results in Fig. 10.
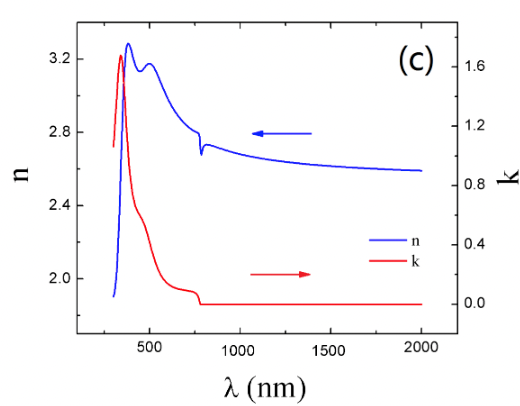
Figure 10: Experimental result of the evolution of the extinction coefficient κ(λ) and refractive index n(λ) with wavelength λ for a tetragonal CH3NH3PbI3 by spectroscopic ellipsometry (SE). Measurements were made on a thin film of MAPI : uniform planar films of MAPI were deposited on quartz and glass substrates via source vapor deposition. SE is a technique for examining the optical properties of film materials with polarized electro-magnetic radiation [24].
The curve for κ(λ) presents 3 absorption peaks. They occur at the following wavelength : λ1 = 776 nm, λ2 = 492 nm, λ3 = 350 nm. The first absorption peak is attributed to MAPI’s direct band gap transition, which is approximately 1.6 eV. 1.6 eV indeed corresponds to 774 nm when using the following relationship : E(eV ) = 1239.8/λ .
Electronic band structure
The band structures for methylammonium lead iodide perovskite are still a subject of research in scientific literature, they can vary greatly depending on the orientation of the methylammonium cation. Ong et al. have shown that the bandgap can go from direct to indirect depending on the orientation of this cation. [24] This means it is difficult to characterize the band structure precisely, the cation can have many orientations, especially in the crystal structures we are mostly interested in: cubic and tetragonal. On the other hand, in the orthorhombic structure, the position of the MA+ cation is fixed, making measurements and/or calculations less challenging to establish.
The band structure of the orthorhombic crystal structure of MAPI is given in Fig. 11. The band gap is direct, it is the difference between the conduction band minimum and the valence band maximum. It occurs at point Γ, the center of the Brillouin zone.

Figure 11: Left : Electronic band structure of orthorhombic methylammonium lead iodide perovskite. The valence band maximum (VBM) and conduction band minimum (CBM) are represented in purple dots. Right : Density of states occupation [10]
As mentioned before, the orientation of the methylammonium cation considerably affects the band structure for the cubic and tetragonal crystalline configurations. For the cubic MAPI, Ahmed et al. [25] obtained its band structure by fixing MA+ in the [0 0 1] orientation. They made a theoretical description of the bands using conventional density functional theory (DFT) and also used relativistic quasi-particle (GW) correction. They also studied the effect of spin orbit coupling correction (SOC) on their results. They concluded that the best results were obtained when both the SOC and GW self-energy corrections were considered. The band structure is given in Fig. 12. The band structure we are focusing on is the solid blue curve (with GW correction). We observe a direct band-gap of 1.48 eV situated at position R of the Brillouin zone. This doesn’t correspond exactly to values found experimentally (cfr Tab. 5) but is a good estimation.

Figure 12: (c) Electronic band structure of cubic methylammonium lead iodide perovskite. MA+ has a fixed orientation of [0 0 1]. The band structure is obtained from ab initio calculation : DFT band structure with SOC with GW (solid blue curve) and without GW (solid red curve) correction. We are only interested in the solid blue curve. (d) Total density of state (DOS) with GW (solid blue curve) and without GW (solid red curve) correction.
Finally, the tetragonal phase : it is the one we are most interested in. It is the most relevant for solar cells as it occurs in the temperature range solar cells are most likely to be in most of the time. 12 Zhu et al. calculated the band structure of tetragonal MAPI with DFT-GW calculations, as seen in Fig. 13. They found a direct bandgap of 1.57eV located at the M point of the Brillouin zone.

Figure 13: Band structure of CH3NH3P bI3 in its tetragonal phase computed by GW-augmented DFT method. The energy of the valence band maximum is set to be zero.[26]
Vibrational properties of your materials
In designing a photovoltaïc panel, it is important for an engineer to control how heat moves through the material. When heat spreads, it actually corresponds to the motion/vibration of atoms and molecules of the structure in the form of phonons. Phonons are the elementary excitation in the quantum mechanical treatment of vibrations in a crystal lattice or the quantum unit of a crystal lattice vibration[27]. They are a type of quasi-particle1 . Phonons have an energy of ℏω, it corresponds to a quanta of excitation of lattice vibration of angular frequency ω. [27] Not unlike photons, phonons are not conserved : they can be created or destroyed when they collide with one another.
If the unit cell has 2 or more atoms, the crystal contains 2 different types of phonons known as acoustic and optical phonons. In this case, the crystal will exhibit 3 acoustic modes : one longitudinal acoustic mode and two transverse acoustic modes. In a unit cell of n atoms, we will have 3n acoustic branches and 3n-3 optical branches.
Optical phonons have higher frequencies and energies.
These phonons are easily excited by light. They are associated with particles in which neighbour atoms oscillate in anti-phase with eachother.
Accoustic phonons possess low frequencies (and hence low energies).
They are associated with long wavelength vibrations : neighbour atoms will tend to oscillate almost in phase with eachother.

The frequency of a phonon depends on the wave vector k, this dependence is known as the phonon dispersion relation. Optical and accoustic phonons have different dispersion relations represented in Fig. 14 for a diatomic linear chain.
Figure 14: Acoustic and optical phonons for a diatomic linear chain [29]
The speed of sound is linked to the slope of the dispersion relation of the acoustic phonon. Acoustic branches tend to have linear dispersions as opposed to optical branches.
Studying phonons is essential, they have a non-negligible impact on several properties of a material such as specific heat capacity, thermal expansion coefficient or thermal conductivity. Additionally, they play a role in determining electrical (and optical) properties. Indeed, it is due to the presence of phonons that charge carriers can potentially move slower.
As mentioned before, it is important to qualify the phonon dispersion relation because thermal conductivity of hybrid perovskites is dominated by phonon transport (among other properties). This further plays a significant role in the energy conversion efficiency. [30]. Ma et al. have experimentally determined the phonon dispersion of tetragonal CH3NH3P bI3 at both 200K and 300K.
.jpeg)
Figure 15: Phonon dispersion curves of tetragonal CH3NH3PbI3 at (a) 300 K and (b) 200 K. The markers are the measured data from IXS (inelastic X-Ray scattering) experiment; the green solid line (LA) and orange solid line (TA) curves are the best fitted curves based on the green and orange markers, respectively. The IXS measurements were performed at the XSD 3-ID beamline of the Advanced Photon Source, Argonne National Laboratory. The wavelength of the X-ray was 0.5725 Å and the focused beam size was 20 µm × 20 µm. [30]
These dispersion curves uncover unique phonon features in inorganic/organic perovskites. Indeed, on Fig. 15, the LA (longitudinal acoustic) curve presents a non-negligible dip at both temperatures, as shown by the green arrow. This softening of the phonon is likely due to the weak electrostatic interaction between CH3NH3+ and the PbI-3 cages. Phonon softening is more important at higher temperatures. It can be assumed that the phenomena of temperature-dependent phonon softening is due to random distortion and rotation of the PbI6 octahedra. Indeed, when temperature changes, the cages will move. These soft acoustic modes present small group velocities, which explains the ultralow thermal conductivity of CH3NH3PbI3.
Moreover, there is no gap between the acoustic and optical branches, most probably due to interaction between the orientation of the organic cation and corner-sharing octahedral inorganic networks. In turn, this leads to acoustic-optical phonon scattering, which decreases phonon lifetime and thus, contributes to the low thermal conductivity of MAPI.
The evolution of thermal conductivity of MAPI as a function of temperature is given in Fig. 16. It illustrates that MAPI indeed has a very low thermal conductivity. A small discontinuity of the thermal conductivity of MAPI is observed at a temperature around 160K. This is related to the transition between orthorhombic and tetragonal phases

Figure 16: Temperature-dependent thermal conductivity for CH3NH3P bI3. Experimental values measured by the longitudinal steady state technique in a closed-cycle helium cryostat at pressure below 10−5 torr. [31]
The thermal conductivity of a material can be defined as :
where Q is the amount of heat transferred, d the distance between the 2 isothermal planes, A the area of the surface and ∆T the difference in temperature.
The thermal conductivity of a material is due to 2 main contributions : contribution of the lattice (acoustic phonons) and contribution of the charge carriers. Indeed, on the one side, there are phonons : they have energy and momentum and can thus conduct heat from hotter regions towards cooler regions. On the other side, we have charge carriers, electrons for example. Electrons can also transport heat : faster electrons transmit energy to slower electrons (colder electrons) by collision. It has been shown by Mettan et al. [32] that the electrical conductivity for MAP bI3 is very low. Hence the electronic contribution to thermal conductivity can be ignored for our perovskite.
The temperature dependence of the lattice thermal conductivity can be expressed by the Debye model as [31] :

where θ = θ_D/ cubic root(n) .
θ_D is the Debye temperature and n the number of atoms in the primitive cell
The Debye temperature is a characteristic specific for each material, it is the temperature at which vibrations reach the maximum possible modes. τ_C is the combined phonon scattering time constant (this will be further developed in Section 9), y = ℏω /kBT is a dimensionless parameter with ω the phonon frequency and v is the speed of sound. This is a theoretical formula that can be used and compared to experimental results to show that only the lattice contributes to the thermal conductivity of MAPI. As this is out of the scope of this section, it will not be done.
It is important to characterize the thermal conductivity of MAPI because it will have a nonnegligible effect on the efficiency of the solar cell. A majority of the solar radiation is converted into heat once it has hit the cell. If this heat is not correctly managed and evacuated, the temperature of the cell could uncontrollably increase and cause damage. MAPI having quite a low thermal conductivity, it essential to control heat generation and remove unwanted heat to prevent damage to the cell. Moreover, when temperature increases, the efficiency of the solar cell decreases, as shown in the Shockley-Queisser page.